In 2024 the claim was made in the Washington Post:
"Much of the crisis, scientists say, can be explained by climate change, which is driving temperatures higher and making rainfall more unpredictable. But it's been exacerbated by the deforestation of the Amazon, which has the potential to disrupt rainfall patterns across much of South America.Sep 12, 2024".
The claim of "climate change" is of course specious, it's an disproven assertion which can be disregarded as the physce does not changes regarless of the temperature, which is the same as it ever was. Which leads us next to deforestation. The idea there, is that water losses from trees, through a biological process called "transpiration" pumps water into the sky and that less trees means less watter in the air which makes less rain.
But trees don't make water, they are hydraulic pumps that disperse water from the ground back into the sky where it came from. So where would it go if the trees were not there? Into rivers that's where. Of course that would wash away all the soil - which has already happened in most equitorial countries, as evidenced by the substrate in those areas being compised soley of red lateritic clay - which does not absorb water well, instead it just runs off. There wuld be more water in rivers if trees were not there at all. Of course the increased amount of water in the rivers, because trees are not holding it, would mean greater evaporation from a now increased water surface would still put water back into the sky. It's intuitive that a 3-dimensional shape of a tree would almost cetainly pump more water into the air than
Which would of course be the end of the rainforest, which would be replaced by a desert. That's what happens when the trees are taken out of the equation - this is called desetification is how the Sahara and the deserts of the middle east came into being; the deserts of Iraq used to be the Gardens of Babylon a lush jungle paradise/ Removing all the trees turned it into a desert.
"Water levels in Iraq's reservoirs and dams have reached historic heights, officials have told AFP, with thousands of families facing possible displacement by more flooding."
So, trees - limited to the context of river water levels do not matter - rain does. Less rain is going to cause lower river levels regardless of how many trees are there are.
The global warming lobby has claimed since the late 1980s - forty years ago from the time of writing - that we would be getting hotter ns drier weather.
But in fact acording to the Brazilin government, has pointed out that
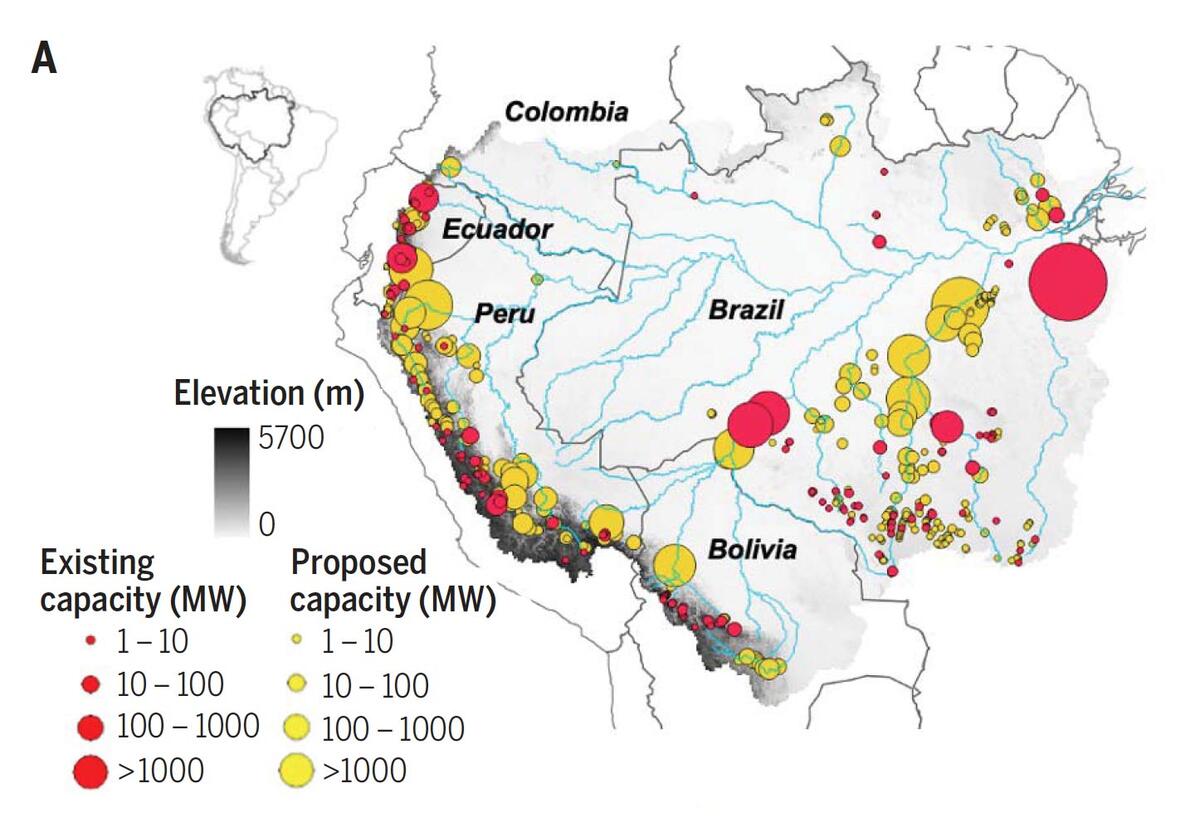
rainfall in Brazil has been up 30% in the past three most recent decades. It's a little unclear from that as they say the extra rainfall is "in the south" and "in parts of the north" but this is irrelevant - there is not less rain and there isn't even the same amount of rain, there's more - and 30% is quita a bit more rain. So whre is al that water going? What wouold physically stop all that water from showing up in rivers? Only one thing does that. Hydroelectric dams, and there are now 150+ new dams in the Amazon with 350+ more plannd or under consruction already.
This can be found on the Brazilian Governent website, which refernces an article statih it's the worst drought in 70 years, an article written by a political science major and it referencrs another US based Climate Study group. All these list deforesttion as the cause (not "warming"). Perhaps, but it seems unlikly that all those new and major dams can not bee seen to be harmless here.
Claims of (literally) "everlasting drought due to man made climate change" in the past decade or so have included Texas (2012-2015), California and Yosemite; California's drought ended with so much rain a major dam burst and there was 165% capacity in those ill fated reservoirs, while in Texas the news changed to "flooding caused by man made climate change". As if. In all cases these droughts were completely normal and certainly not as long as they have been in the past and it's almost as if the words "drought" in the media cause torrential rain, as it seems to happen every time.

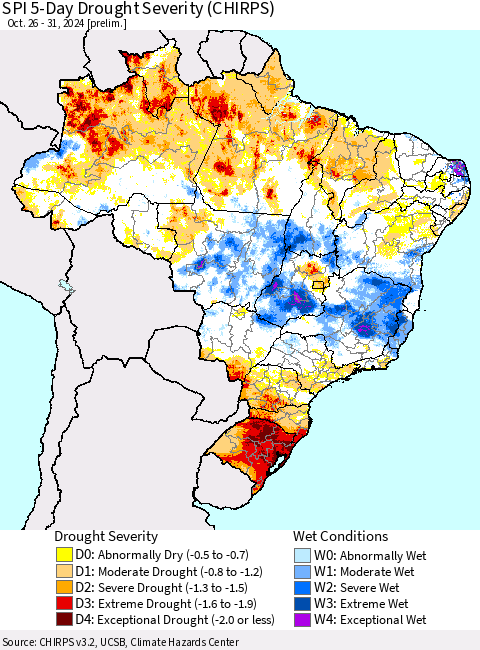
What seems to be ignored are the 158 existing and 351 proposed hydro-electric dams in the Amazon and claim its "climate" that's causing severely low water levels and the proof is some US maps and charts - that I'm afraid do not prove anything other than the reader doesn't know what they are actually looking at. That is they look like a graph of historical temperatures but they are anything but.
Which of course are very heavily massaged numbers, adjusted with statistical methods until they show something completely different from what the original data actually was. We saw this with the "global warming" hysteria and the same errant statistical methods were used to try to prove this. Apparently with normal levels or rainfall, it's "climate change" and not the plethora of Brazilian dams in the mighty Amazon that are causing this, a specious and seriously flawed argument on the face of it.
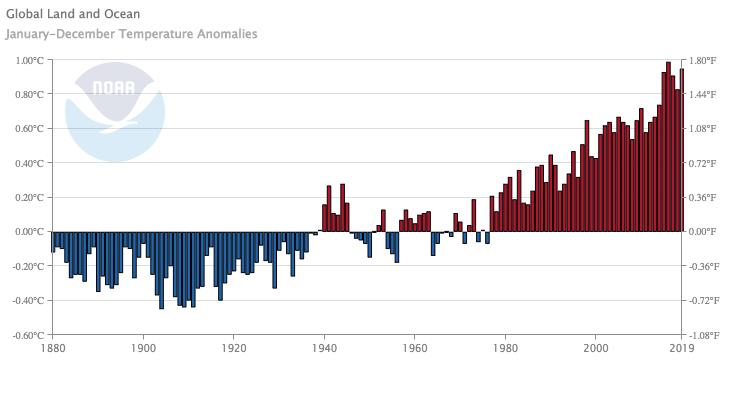
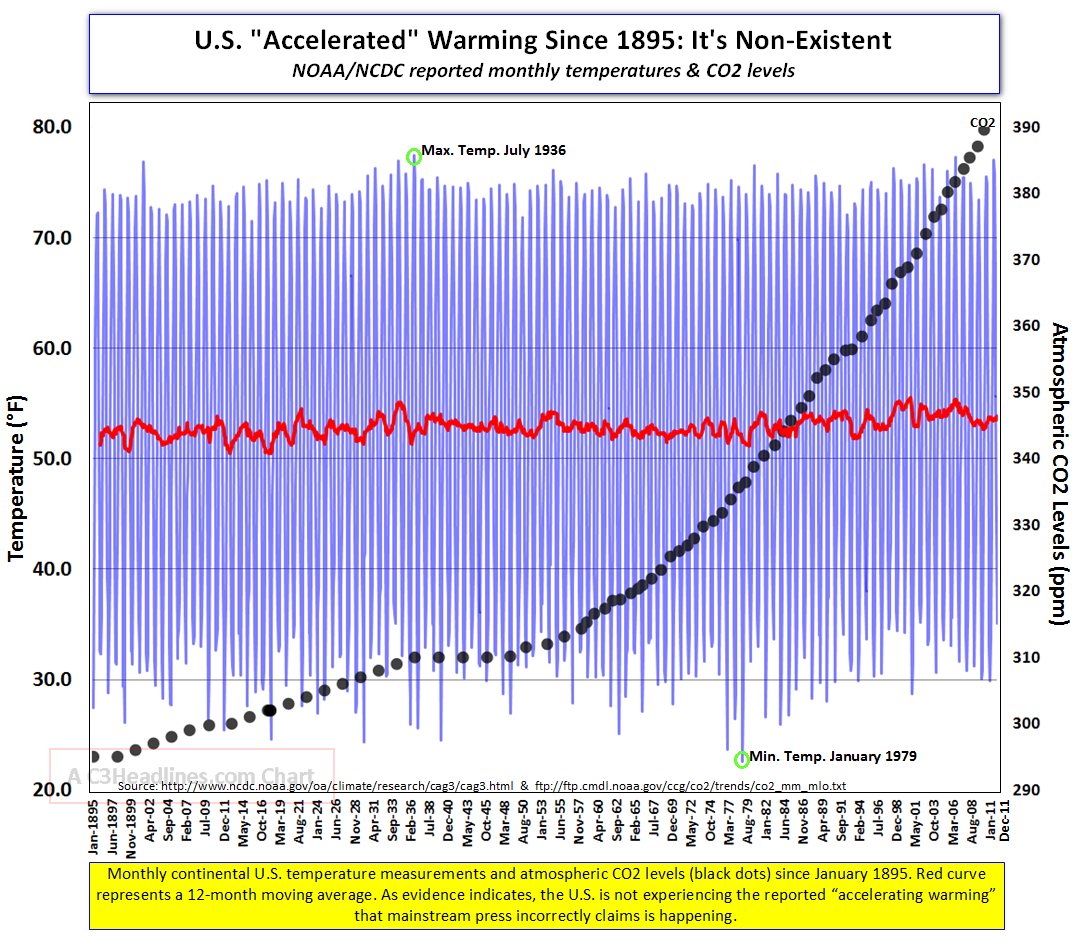
Here are two graphs. They show the same thing, a century or so of temperature records. One shows what the temperature has been every year for the last 120 years while the other shows how much warming there has been in this interval. Notice they are completely different. One is a graph of actual annual temperature shown for a large number of years, prepared from US NOAA data (which anybody can verify as the data is all online) by aerospace engineer Burt ("Gossamer Albatross") Rutan.
The other is "deviation from the xxxx year to yyyy year average. These numbers have changed a few times leading to graphs that don't even agree with each other, yet all of them are considered "correct" in the contemporaneous popular press.
This is a graph of actual temperatures. The red line is the 12-month moving average and from that you can read the annual average temperature of any year.
| |

This is a map of "deviations from the 1951 to 1980 average", that is the deviation/anomaly from the data from that range to a cherry picked average of a sub-range is used as the basis of comparison for all data for the entire 120 years.
But as a mathematician with expertise in the use of language in reasoning, I'm obliged to point out that if you change those endpoints ("sub-range") you can then make this graph show warming, cooling or no change at all. Things like this are the origin no doubt of the famous Twain quote "there are lies, damned lies and then there are statistics" as too often they are used to "prove" to people that do not understand mathematics, the exact opposite of what the data actually represents.
Also the use of the word "anomaly" is technically incorrect as it is not any sort of anomaly outside the false context of the adjusted data, barring that - it is not "anomalous" at all. Lies, damn lies and statistics. Note also these are all purported to be logical arguments, but they're based on a false premise, and no facts may be discernedfrom that.
|
Good, concise and informative maps of Brazilian rainfall, if shown in mm of rain are one thing. But when you see maps that use the term "deviation" or "anomaly" then the numbers have been "massaged" with statistical methods, that any math grad will say of it: "you can't do that!" or "D- See me after class" or both. You need to see the raw data to form any conclusions.
The other thing is, from May to October is the dry season in Brazil. Of course these "drought" maps showed up in September and October. This is the same as showing the loss of ice in before/after photos, but the before shot is late winter and the after shot is late summer. That's not how you prove year to yeat ice loss!
How can you have a negative number for rainfall? You can't of course, and it means it's a deviation from some statistical average. Without knowing what was done, how and what the endpoints/range (often cherry picked to show something that isn't shown without applying these statistical methods) then the information is literally meaningless.
Better then, to stick to rainfall maps that show precipitation in mm. See the difference between the US-manipulated Brazilian rainfall maps and Brazilian rainfall maps produced in Brazil that simply show how much rain there was without having to "adjust" it.
Think of it this way, do you want to look at a graph of the data and form your own conclusion?
Or do you want to look at a graph that is an interpretation of that same data, that - at best, is non-obvious and poorly documented statistical methods and at worse unlabeled graphs that have methods hidden to the point of being a secret - that are invalid statistical methods.
Facebook uses the latter to "prove" climate change, but the thing is a graph with no labels is meaningless and irrelevant in the strictest sense. This is taught in grade 6 in most places.


